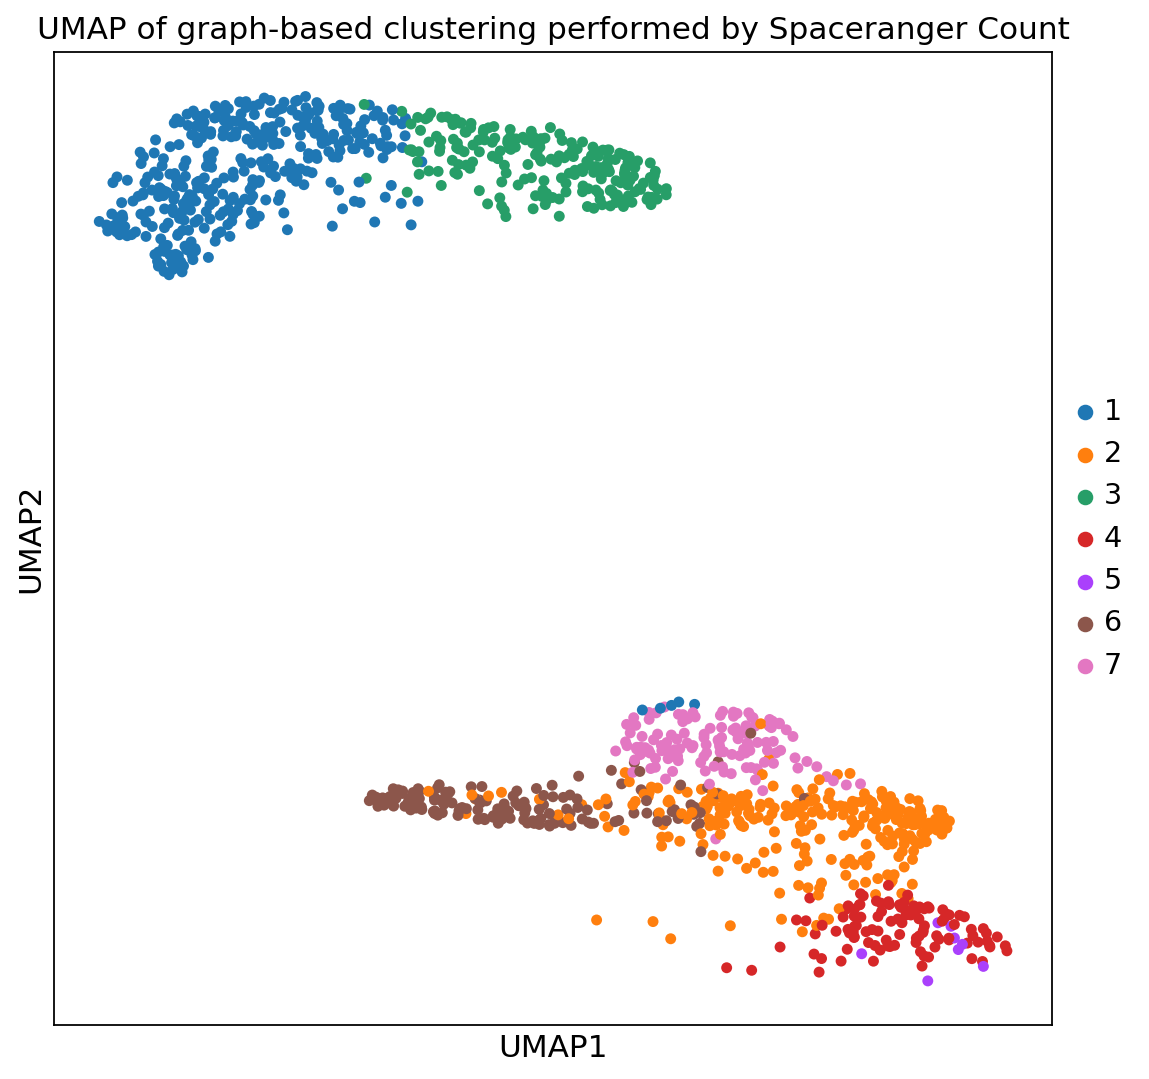
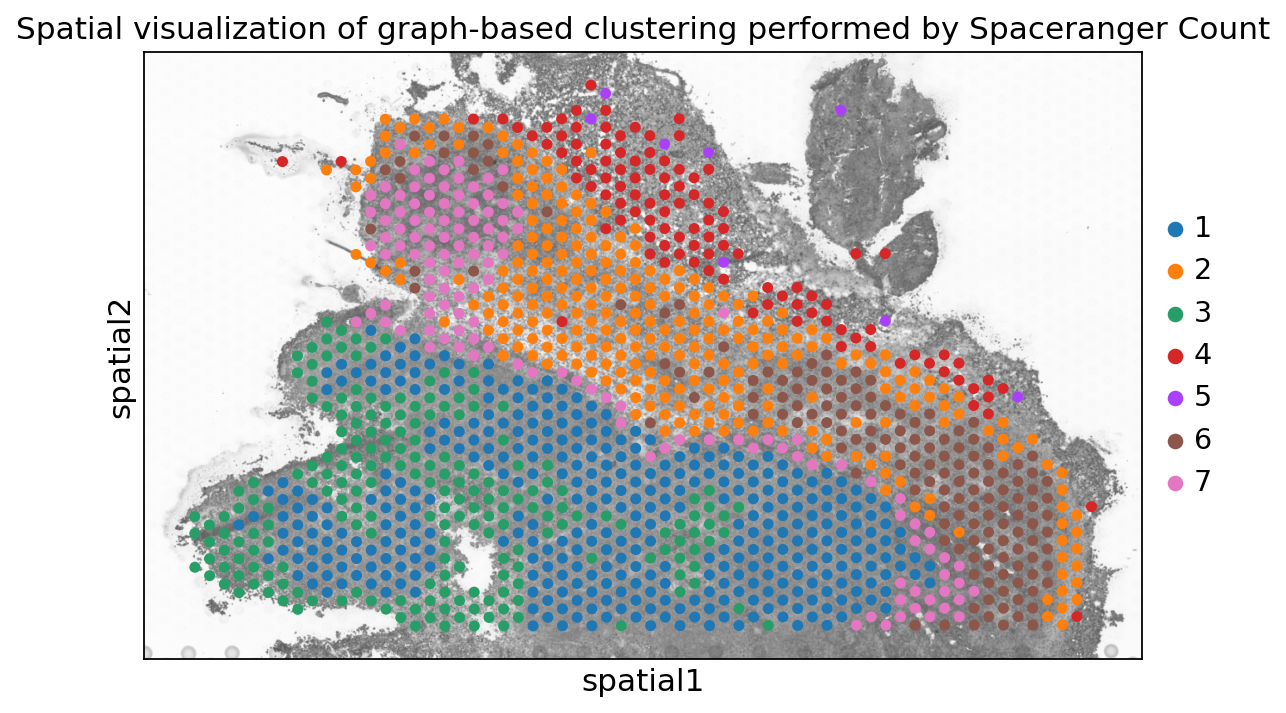
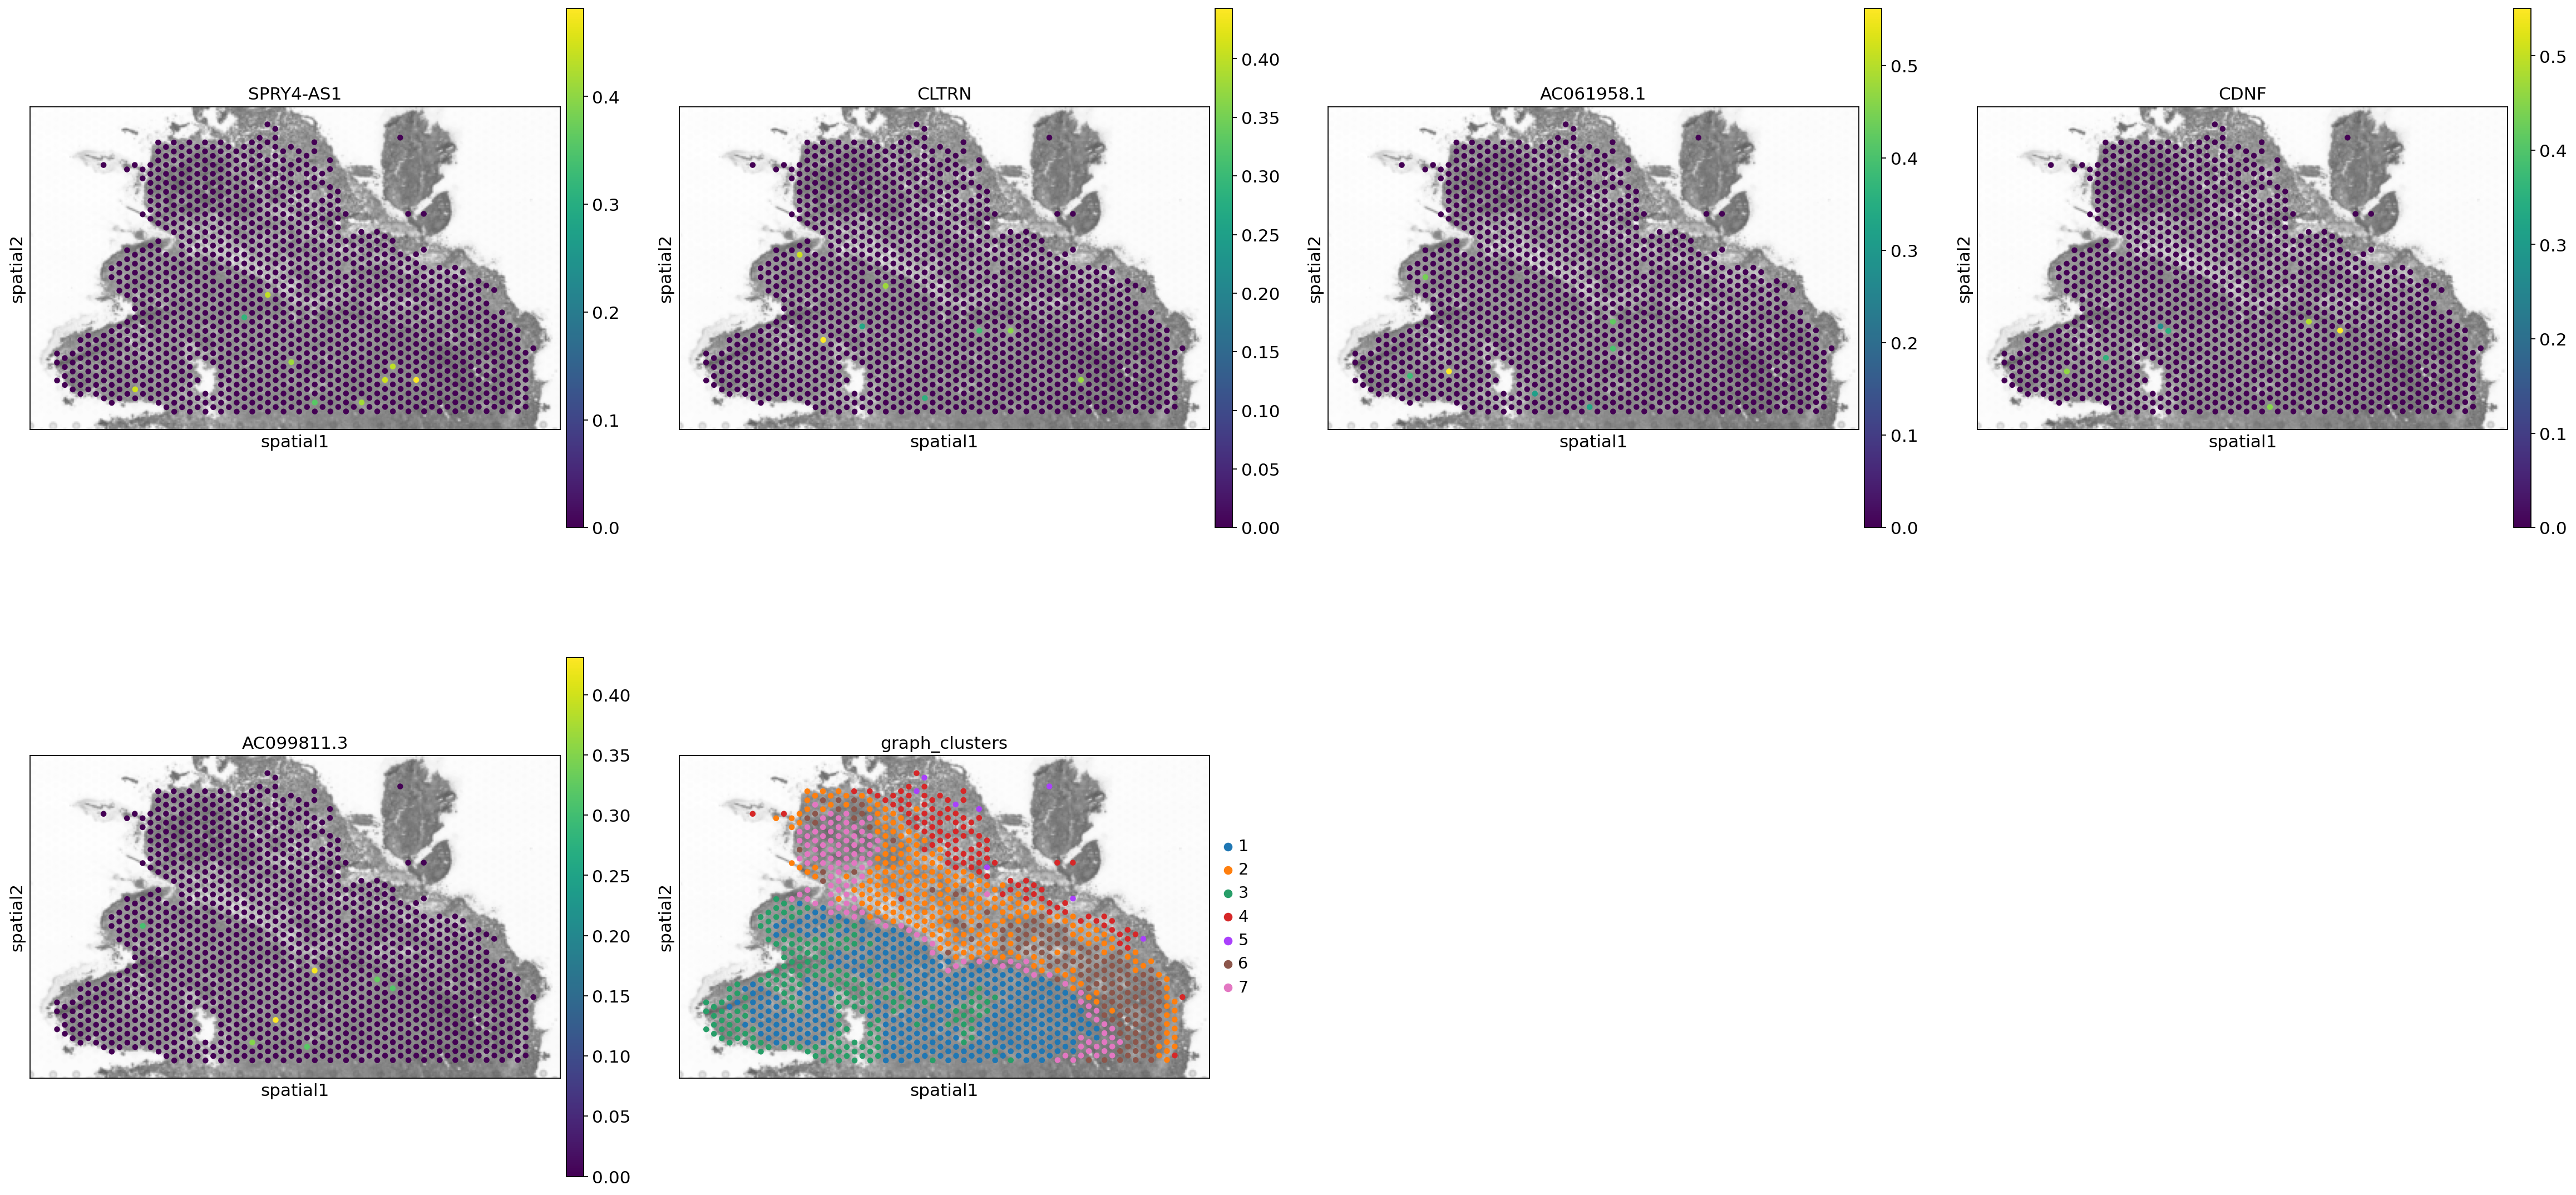
spaceranger count pipeline produces feature-barcode matrices as well as performing dimensionality reduction, clustering, and differential gene expression analysis. The results directory of the pipeline can be stored in your Mantle Database using the spaceranger-count-outputs data type.
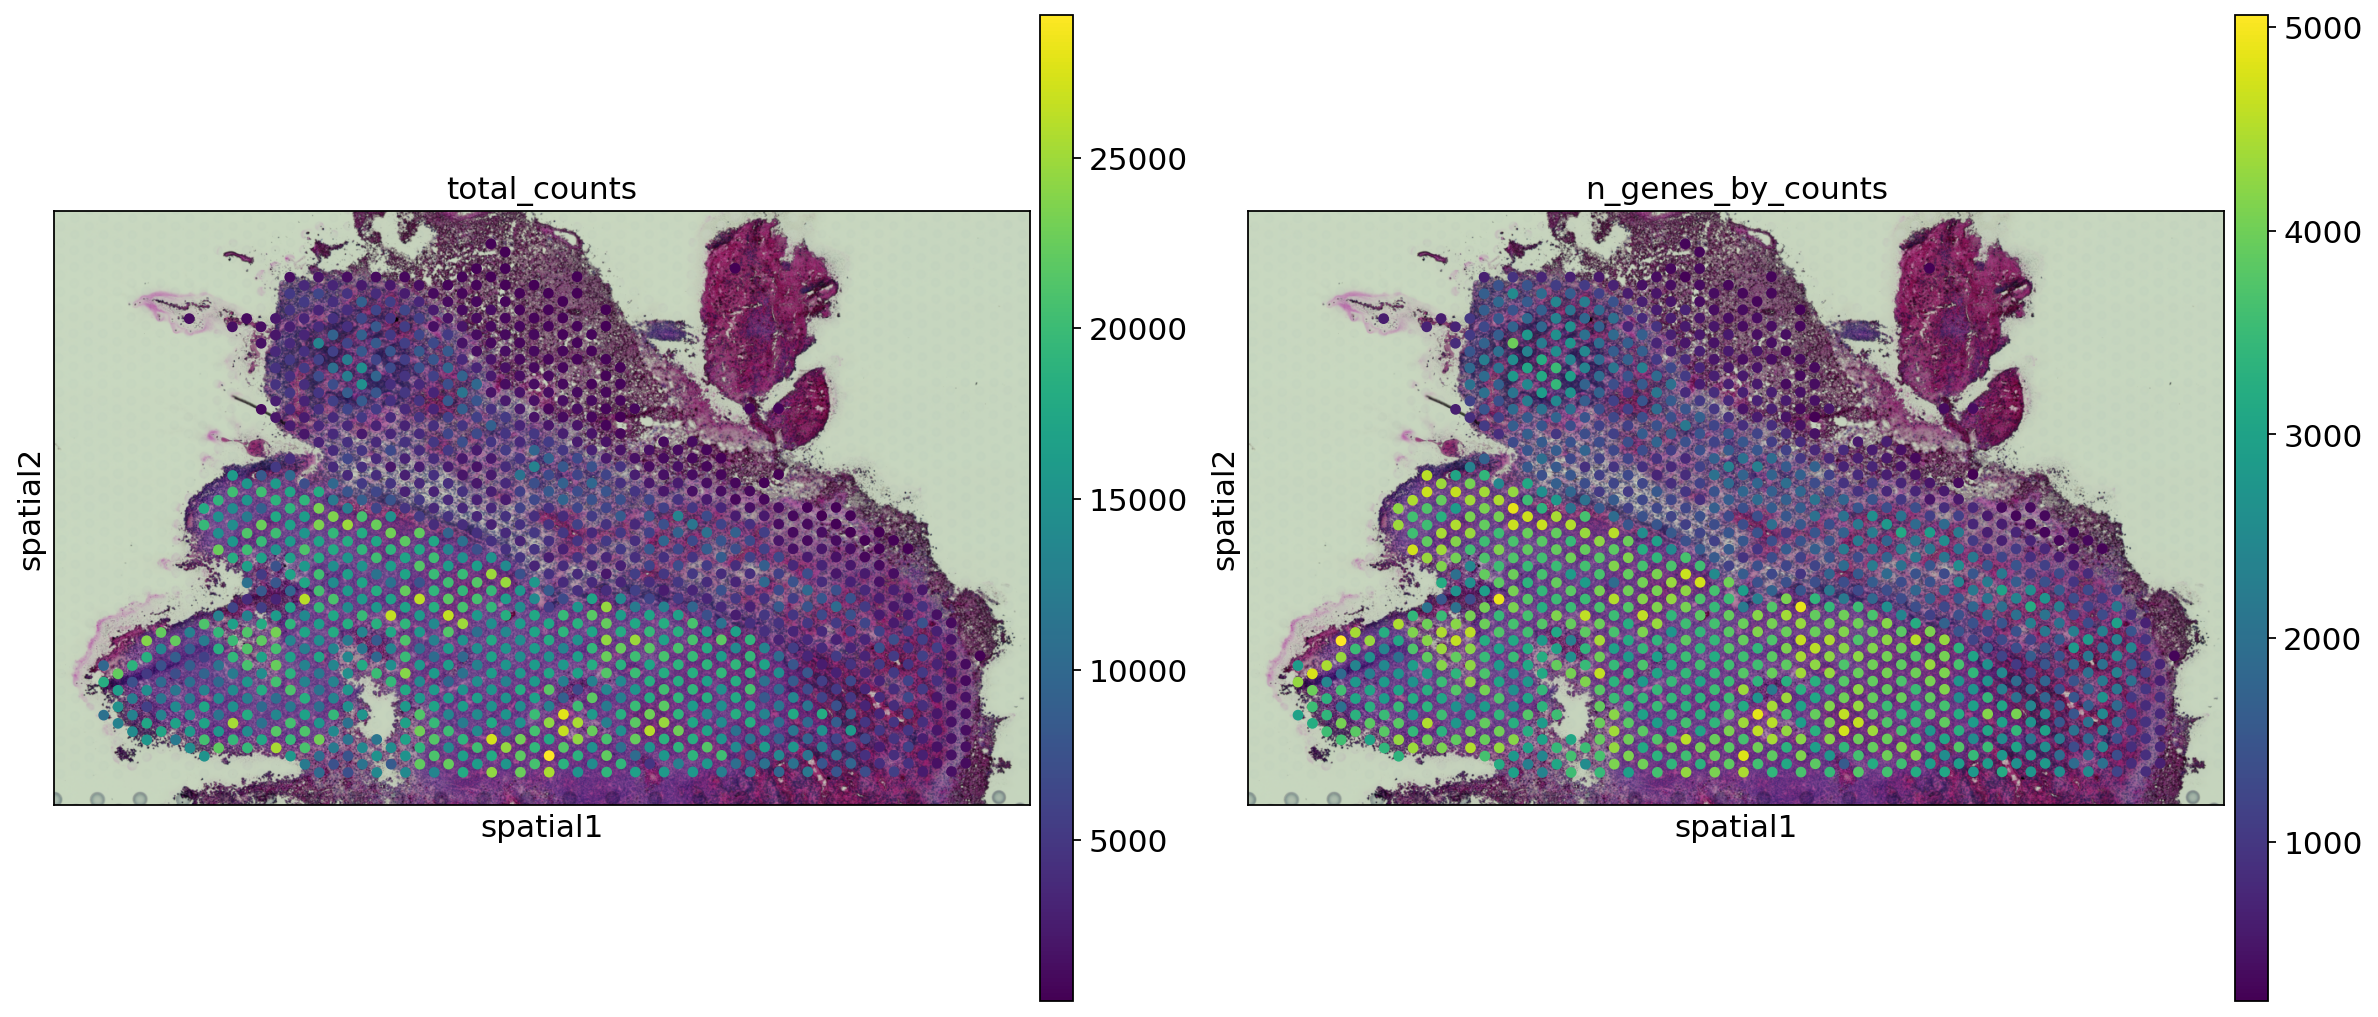
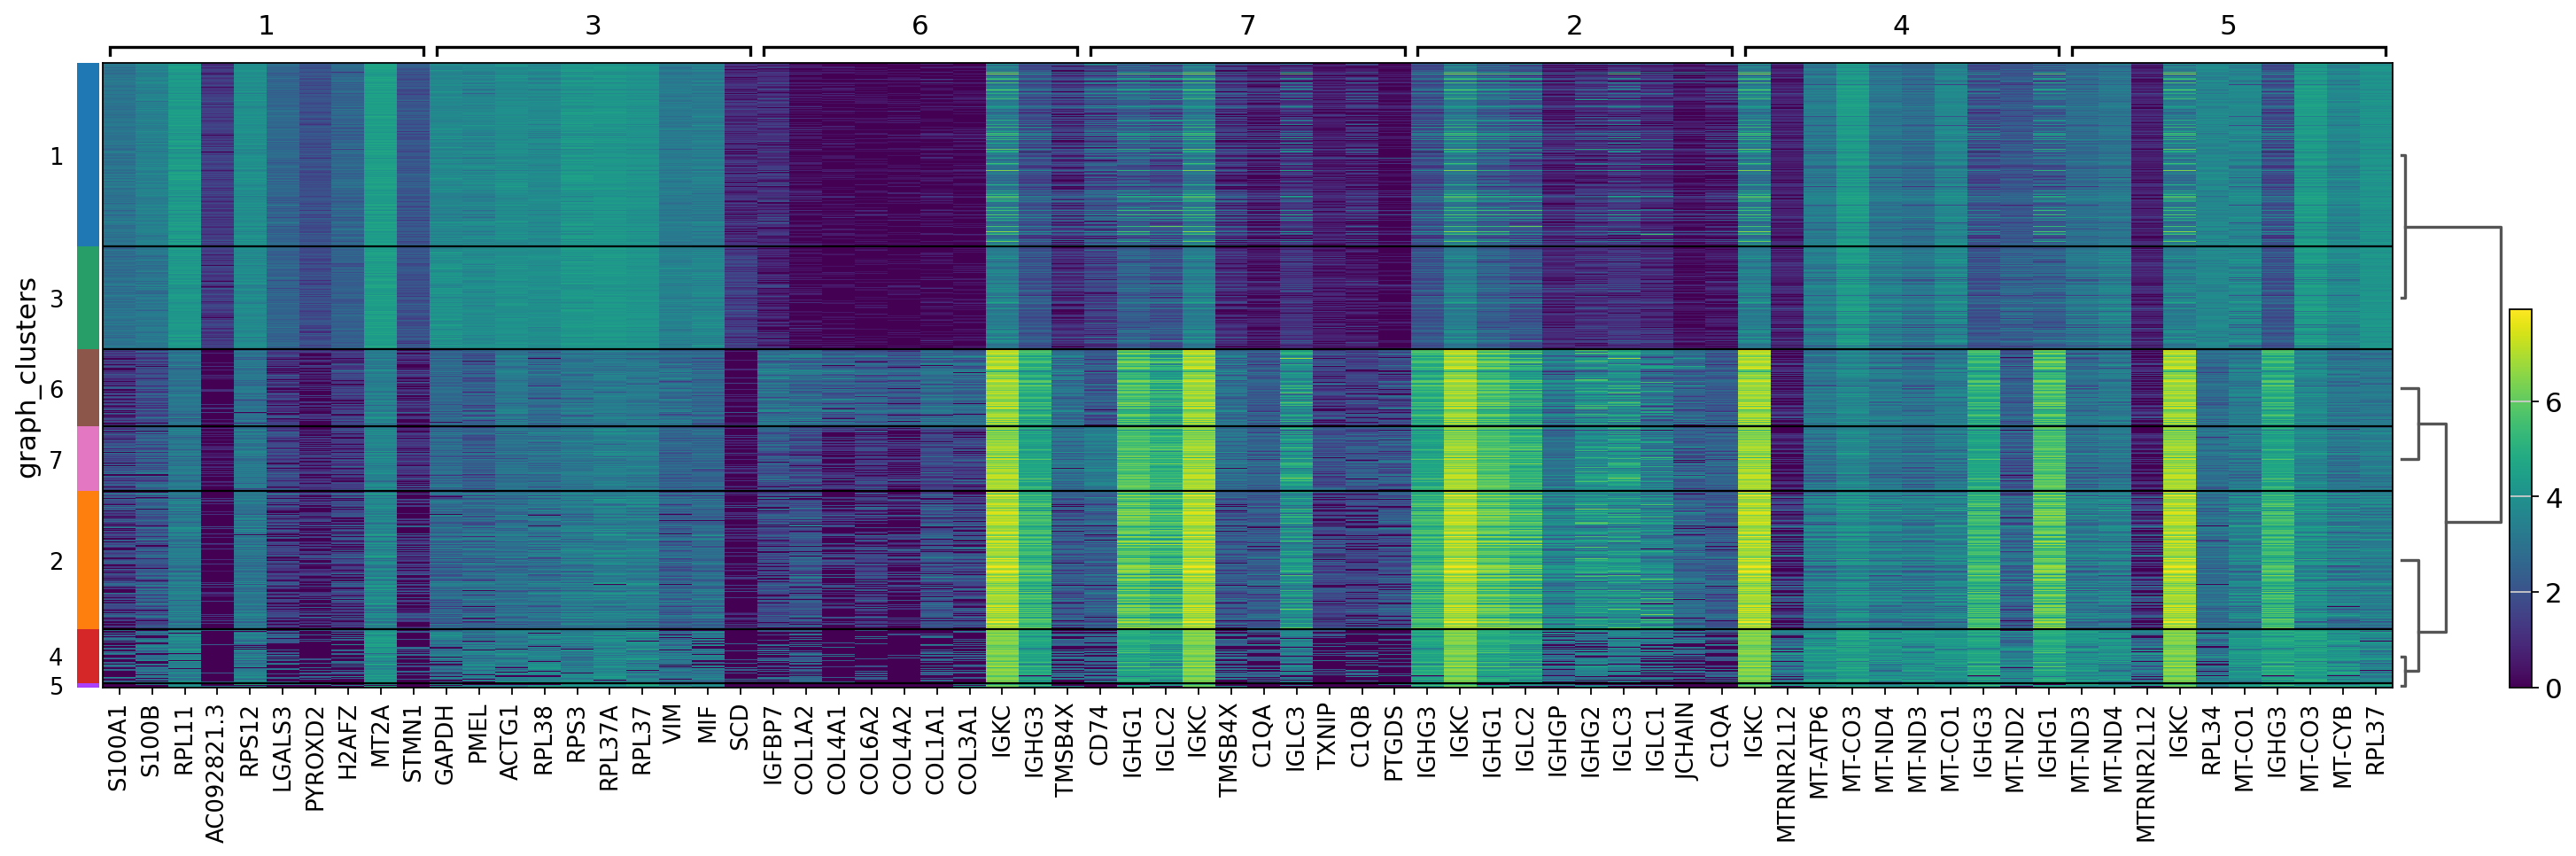
In this notebook, we use Scanpy to take a closer look at some of the results. The Visium data were originally from:
- Sudmeier, et al. (2022) “Distinct phenotypic states and spatial distribution of CD8+ T cell clonotypes in human brain metastases.” Cell Reports Medicine, 3(5), 100620